Seasonalities and Holidays
Despite that time-series modeling is not super feature-rich, we can still leverage at least deterministic features which are known in advance - calendar patterns.
The easiest way how to model seasonality and leverage the power of ML models is to create a binary feature for each repeating calendar pattern (day of the week, the month of the year…). This is implemented in the SeasonalityTransformer.
[1]:
import pandas as pd
import numpy as np
import matplotlib.pyplot as plt
plt.style.use('seaborn')
plt.rcParams['figure.figsize'] = [12, 6]
[2]:
from hcrystalball.utils import get_sales_data

df = get_sales_data(n_dates=365*2,
                    n_assortments=1,
                    n_states=1,
                    n_stores=1)[:"2014-12-31"]
X, y = pd.DataFrame(index=df.index), df['Sales']
Seasonality Features
[3]:
from hcrystalball.feature_extraction import SeasonalityTransformer
SeasonalityTransformer(freq = 'D').fit(X, y).transform(X).head()
[3]:
| _Friday | _Monday | _Saturday | _Sunday | _Thursday | _Tuesday | _Wednesday | _1_week | _2_week | _3_week | ... | _May | _November | _October | _September | _1_quarter | _2_quarter | _3_quarter | _4_quarter | _2013 | _2014 | |
|---|---|---|---|---|---|---|---|---|---|---|---|---|---|---|---|---|---|---|---|---|---|
| Date | |||||||||||||||||||||
| 2013-08-01 | 0 | 0 | 0 | 0 | 1 | 0 | 0 | 0 | 0 | 0 | ... | 0 | 0 | 0 | 0 | 0 | 0 | 1 | 0 | 1 | 0 |
| 2013-08-02 | 1 | 0 | 0 | 0 | 0 | 0 | 0 | 0 | 0 | 0 | ... | 0 | 0 | 0 | 0 | 0 | 0 | 1 | 0 | 1 | 0 |
| 2013-08-03 | 0 | 0 | 1 | 0 | 0 | 0 | 0 | 0 | 0 | 0 | ... | 0 | 0 | 0 | 0 | 0 | 0 | 1 | 0 | 1 | 0 |
| 2013-08-04 | 0 | 0 | 0 | 1 | 0 | 0 | 0 | 0 | 0 | 0 | ... | 0 | 0 | 0 | 0 | 0 | 0 | 1 | 0 | 1 | 0 |
| 2013-08-05 | 0 | 1 | 0 | 0 | 0 | 0 | 0 | 0 | 0 | 0 | ... | 0 | 0 | 0 | 0 | 0 | 0 | 1 | 0 | 1 | 0 |
5 rows × 77 columns
Holiday Features
One of the important parts of time-series modeling is taking into account holidays which in most cases exhibit different behavior than it’s common. hcrystalball implements HolidayTransformer which returns column with string name of the holiday based on provided country ISO code for each date in the dataset (empty string if it’s not a holiday). All hcrystalball wrappers accept the output of HolidayTransformer and transform it into individual model formats. HolidayTransformer also supports
some region specific holidays i.e. Germany state specific holidays, in that case the provided string shoule be in form country-region: i.e. ‘DE-HE’.
[4]:
from hcrystalball.feature_extraction import HolidayTransformer
HolidayTransformer(country_code = 'DE').fit(X, y).transform(X).tail(10)
[4]:
| _holiday_DE | |
|---|---|
| Date | |
| 2014-12-22 | |
| 2014-12-23 | |
| 2014-12-24 | |
| 2014-12-25 | Christmas Day |
| 2014-12-26 | Second Christmas Day |
| 2014-12-27 | |
| 2014-12-28 | |
| 2014-12-29 | |
| 2014-12-30 | |
| 2014-12-31 |
The holiday effects have very often impact on target variable even before or after holidays (i.e. whole Christmas period is affected by few public holidays), in order to model such effects around holiday HolidayTransformer provides 3 parameters - days_before - number of days the before public holiday which should be taken into account, days_after - number of days before the public holiday which should be taken into account and bool variable bridge_days which will create variable
for the overlaping days_before and days_after feature - mostly for modeling working days in the middle of two public holidays.
[5]:
from hcrystalball.feature_extraction import HolidayTransformer
HolidayTransformer(country_code = 'DE', days_before = 2, days_after = 1, bridge_days = True).fit(X, y).transform(X)['2014-04-16':'2014-04-23']
[5]:
| _holiday_DE | _2_before_holiday_DE | _1_after_holiday_DE | _bridge_holiday_DE | |
|---|---|---|---|---|
| Date | ||||
| 2014-04-16 | True | False | False | |
| 2014-04-17 | True | False | False | |
| 2014-04-18 | Good Friday | False | False | False |
| 2014-04-19 | True | True | True | |
| 2014-04-20 | True | False | False | |
| 2014-04-21 | Easter Monday | False | False | False |
| 2014-04-22 | False | True | False | |
| 2014-04-23 | False | False | False |
In Pipelines
It is possible to combine more countries/regions for the holidays. The behovior of multi holidays is wrapper specific.
[6]:
from hcrystalball.compose import TSColumnTransformer
from hcrystalball.wrappers import ExponentialSmoothingWrapper
from hcrystalball.wrappers import get_sklearn_wrapper
from sklearn.ensemble import RandomForestRegressor
from sklearn.pipeline import Pipeline
from sklearn.preprocessing import OneHotEncoder
[7]:
from hcrystalball.wrappers import SarimaxWrapper
[8]:
pipeline = Pipeline([
    ('holidays_de', HolidayTransformer(country_code = 'DE')),
    ('holidays_be', HolidayTransformer(country_code = 'BE')),
    ('seasonality', SeasonalityTransformer(freq='D')),
    ('model', get_sklearn_wrapper(RandomForestRegressor, random_state=42))
])
[9]:
preds = (pipeline.fit(X[:-10], y[:-10])
.predict(X[-10:])
.merge(y, left_index=True, right_index=True, how='outer')
.tail(50))
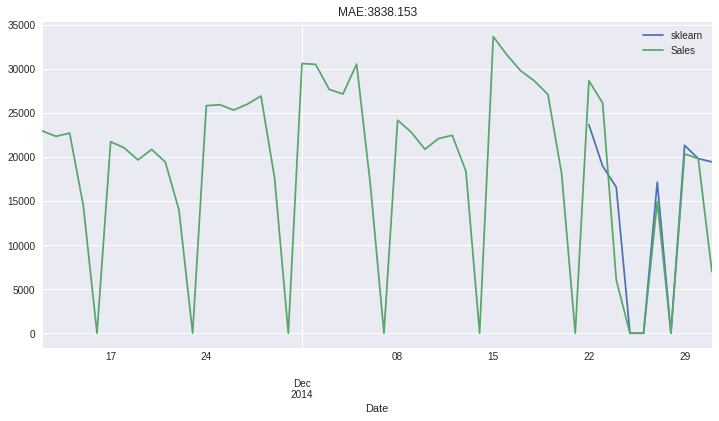
preds.plot(title=f"MAE:{(preds['Sales']-preds['sklearn']).abs().mean().round(3)}");
[9]:
<AxesSubplot:title={'center':'MAE:3838.153'}, xlabel='Date'>
Also country code column can be used.
Note: This column is deleted in ``HolidayTransformer.transform`` method in order not to pollute the further processing
[10]:
pipeline_col = Pipeline([
    ('holidays_de', HolidayTransformer(country_code_column = 'germany')),
    ('holidays_be', HolidayTransformer(country_code_column = 'belgium')),
    ('seasonality', SeasonalityTransformer(freq='D')),
    ('model', get_sklearn_wrapper(RandomForestRegressor, random_state=42))
])
[11]:
X_col = X.copy().assign(germany='DE').assign(belgium='BE')
[12]:
preds_col = (pipeline_col.fit(X_col[:-10], y[:-10])
         .predict(X_col[-10:])
         .merge(y, left_index=True, right_index=True, how='outer')
         .tail(50))

preds_col.plot(title=f"MAE:{(preds_col['Sales'] - preds_col['sklearn']).abs().mean().round(3)}");
[12]:
<AxesSubplot:title={'center':'MAE:3838.153'}, xlabel='Date'>

With exogenous variables
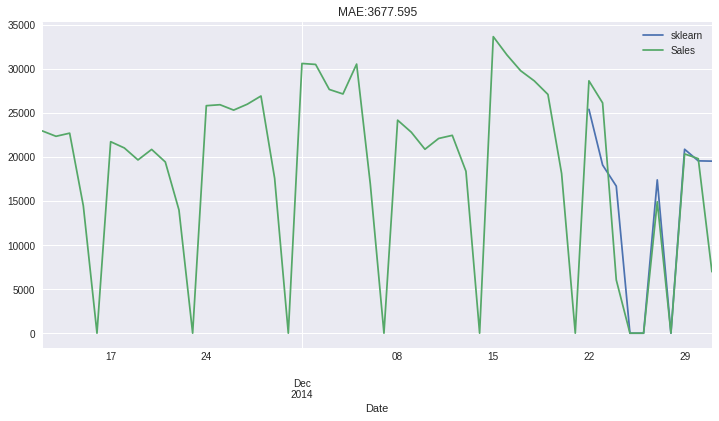
[13]:
X_col['trend'] = np.arange(len(X))
[14]:
preds_col = (pipeline_col.fit(X_col[:-10], y[:-10])
         .predict(X_col[-10:])
         .merge(y, left_index=True, right_index=True, how='outer')
         .tail(50))

preds_col.plot(title=f"MAE:{(preds_col['Sales'] - preds_col['sklearn']).abs().mean().round(3)}");
[14]:
<AxesSubplot:title={'center':'MAE:3677.595'}, xlabel='Date'>
Individual holidays as separate columns
[15]:
sklearns_native_transformers = TSColumnTransformer(
    transformers=[
        ('one_hot_encoder', OneHotEncoder(sparse=False, drop='first'), ['_holiday_CZ'])
    ])

pipeline_col = Pipeline([
   ('holidays', HolidayTransformer(country_code='CZ')),
    ('one_hot_encoder', sklearns_native_transformers)
])
[16]:
pipeline_col.fit_transform(X_col['2013-12-20':'2013-12-26'])
[16]:
| x0_Christmas Day | x0_Christmas Eve | x0_St. Stephen's Day (The Second Christmas Day) | |
|---|---|---|---|
| Date | |||
| 2013-12-20 | 0.0 | 0.0 | 0.0 |
| 2013-12-21 | 0.0 | 0.0 | 0.0 |
| 2013-12-22 | 0.0 | 0.0 | 0.0 |
| 2013-12-23 | 0.0 | 0.0 | 0.0 |
| 2013-12-24 | 0.0 | 1.0 | 0.0 |
| 2013-12-25 | 1.0 | 0.0 | 0.0 |
| 2013-12-26 | 0.0 | 0.0 | 1.0 |